Introduction
Lotteries are among the most popular numbers games globally. However, many players do not realize the staggering mathematical differences between various national games. From combinatorics to return-to-player (RTP) models, this guide directly compares China’s SSQ, America’s Powerball, Europe’s EuroMillions, and Canada’s Lotto 6/49.
1. Rule Mechanics and Jackpot Odds Comparison
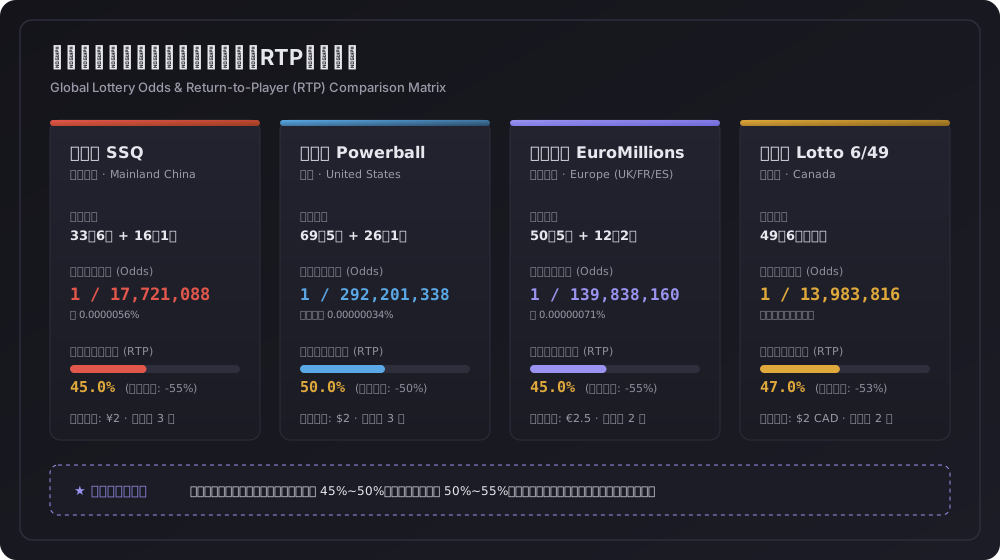
Different lotteries adjust ball pool sizes and pick numbers to tune the jackpot frequency. The combinatorial formula is C(n, k) = n! / (k! × (n - k)!). For dual-matrix games with secondary balls (Powerball, blue balls, Lucky Stars), total combinations equal the product of both independent draws.
| Game | Region | Rules | Jackpot Odds (1 in) | Probability % | Price |
|---|---|---|---|---|---|
| SSQ | China | 6 of 33 Red + 1 of 16 Blue | 1 / 17,721,088 | 0.0000056% | ¥2.00 |
| Powerball | USA | 5 of 69 White + 1 of 26 Red | 1 / 292,201,338 | 0.00000034% | $2.00 |
| EuroMillions | Europe | 5 of 50 Main + 2 of 12 Stars | 1 / 139,838,160 | 0.00000071% | €2.50 |
| Lotto 6/49 | Canada | 6 of 49 Single Matrix | 1 / 13,983,816 | 0.00000715% | $2.00 CAD |
Key takeaway: Lotto 6/49 offers the comparatively easiest jackpot (≈1 in 14M), while US Powerball is mathematically the most brutal (≈1 in 292M) — 16.5 times harder than SSQ and almost 21 times harder than 6/49.
2. Return to Player (RTP) and the 50% House Edge
Return to Player (RTP) represents the theoretical percentage of wagered money that a game pays back over the long haul. While casino roulette offers 95%~97.3% RTP, government-run lotteries are designed with much harsher returns:
- SSQ: Approximately 36% goes to public welfare funds, 13% to admin and sales costs, leaving only ≈50% in the total prize pool (effective long-run RTP ≈45%~50%).
- Powerball: 50% of revenue funds prizes; the other 50% finances state initiatives (education, parks) and overhead.
- EuroMillions: Long-term effective prize pool return oscillates around 45%~50%.
- Lotto 6/49: Overall expected return is roughly 47%.
3. Rolling Jackpots: Is Playing Ever Mathematically Profitable?
When Powerball or EuroMillions reaches hundreds of millions of dollars, players often speculate whether the expected value (EV) becomes positive.
In reality, three factors prevent this:
- Split Jackpot Risk: Massive prize pools trigger ticket-buying frenzies, drastically increasing the likelihood of multiple jackpot winners splitting the purse.
- Taxes and Lump-Sum Reductions: A nominal $500M US jackpot dwindles to ≈$250M cash option before a 37% federal tax and state levies, leaving only 30%~40% of headline value.
- Lower Tiers Stay Flat: Secondary tier payouts do not scale with the jackpot; in 99.99999% of cases, your ticket contributes only to the house margin.